What road safety looks like for different users
Around two thirds of people who lose their lives or are seriously injured in road crashes are motor vehicle occupants, and a third are people on motorcycles or bicycles, or pedestrians.
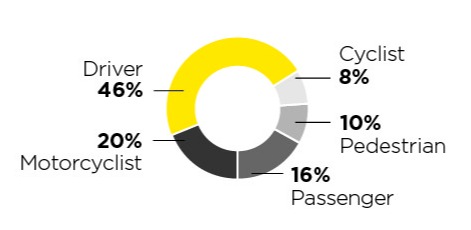
Proportion of lives lost and serious injuries by road user type, 2016–2020, South Australia

| Road user type | Proportion of lives lost |
|---|---|
| Driver | 46% |
| Motorcyclist | 20% |
| Cyclist | 8% |
| Pedestrian | 10% |
| Passenger | 16% |
Younger road users
The number of young people being killed or seriously injured on South Australian roads has declined in the last decade, although young people continue to be over represented in road crashes, much more so than older age groups.
People aged 16 to 24 years make up 11% of the population, but account for 21% of all lives lost and 20% of all serious injuries in South Australia. 81% of drivers or riders aged 16 to 24 who lost their life were male. Most young drivers (96%) are responsible for the fatal crash they are involved in.
Younger drivers and riders in regional and remote South Australia
Young drivers and riders aged 16 to 24 living in regional or remote South Australia are around three times more likely to be involved in a crash where they lose their life or are seriously injured compared with Adelaide residents of the same age.
Older road users
Older road users (70+) make up 13% of the population yet account for 23% of all lives lost and 14% of serious injuries. Older drivers are involved in a relatively small number of crashes, but these crashes are more likely to be more severe in part due to the fragility and frailty of these older users (and sometimes as a result of the lower level of protection provided by older vehicles).
Older pedestrians have a higher risk of collision with road vehicles due to the perceptual, cognitive and physical deterioration associated with ageing. If an older person is hit by a car, the outcome is likely to be more severe, resulting in a life lost rather than an injury. Older pedestrian rates of lives lost or serious injury increases around the age of 70.
A study led by the Centre for Automotive Safety Research found that 11% of hospitalisation crashes were the result of a medical condition or medical event. For crash-involved people over the age of 70, this proportion increased to 34%. So for older people, medical fitness to drive is an important consideration.2
Older road user crashes are likely to continue to increase in future years due to the growing number of people in the 70+ age cohort. In 2019, 13% of South Australia’s population were aged 70 or over. The number and proportion of older South Australians is expected to continue to grow. By 2031, it is projected there will be over 310,000 older people in South Australia (17% of the population), an increase of 85,000 older people.3
People aged 70+
- Accounted for about 13% of the State’s population in 2019
- By 2031, over 310,000 South Australians will be in the 70+ age group.
Older drivers
Older drivers are generally more cautious and tend to exhibit less illegal and dangerous driving behaviour than other age groups. They also typically control their exposure to risk when driving by avoiding driving at night or in peak hours.
Older drivers are more likely to be involved in fatal and serious injury crashes at intersections involving right angle crashes. Intersections and junctions are complex traffic environments, in which the driver has to attend to a variety of information while under time pressures. Taking into account licence numbers, drivers in the 70-79 year old age group have the lowest rate of involvement in crashes where lives are lost or serious injuries occur. This increases in the
80-89 year age group and again for drivers aged 90 and over.
Aboriginal people
Aboriginal people comprise approximately 2.4% of South Australia’s population but are 2-3 times more likely to lose their life and 30% more likely to have a serious injury than non-Aboriginal people.4 This over-representation extends across many public health issues including involvement in road crashes.
Sixty nine per cent of the light vehicles driven by Aboriginal people involved in crashes resulting in a life lost or serious injury were aged 10 years old or more. This is higher than crashes resulting in a life lost or serious injury in general where around 60% of all light passenger vehicles are aged 10 years or more.
Aboriginal drivers and riders represent 3.0% of all drivers/riders involved in crashes resulting in a life lost or serious injury on South Australian roads yet represent approximately 1.7% of all South Australian licence holders.
Aboriginal people aged 16 to 29 years represent 36% of Aboriginal licence holders yet 47% of the Aboriginal drivers and riders involved in crashes resulting in a life lost or serious injury were in the 16–29 year age group.
Twenty per cent of Aboriginal drivers who lost their life or were seriously injured were recorded as not wearing a seatbelt at the time of their crash (where this information was known). For drivers in general, 9% of drivers who lost their life or were seriously injured were not wearing a seatbelt.
Twenty six per cent of Aboriginal drivers and riders who lost their life or were seriously injured (and tested) had an illegal blood alcohol concentration (BAC) at the time of the crash. For drivers and riders in general; 12% of drivers and riders who lost their life or were seriously injured recorded an illegal BAC.
A limitation of the data analysis exists because not all individuals will self-identify their Aboriginal and Torres Strait Islander status when interacting with the department. Additionally the road crash database does not record Aboriginal and Torres Strait Islander information and therefore no such data is available to incorporate numbers of Aboriginal and Torres Strait Islander passengers, pedestrians or cyclists injured in road crashes.
It is likely that Aboriginal road safety data is under reported when taking into account the under representation in road safety data and the over-representation in public health data (presenting with injuries).
Transport disadvantage can increase risks of road trauma. Aboriginal people are more likely to experience social exclusion – related to limited, or no access to transport.5 Lack of access to transport options can lead people to make unsafe transport decisions whether they are a driver, passenger or pedestrian. Socio economic disadvantage also increases the risk of road trauma through the poor condition of ill maintained vehicles. Similarly, the lack of access and affordability of vehicles with a high safety rating results in lesser protection of occupants. Other forms of disadvantage, such as poor health and education can be compounded for Aboriginal people experiencing transport disadvantage.6
Pedestrians
| Lives lost | 13% |
|---|---|
| Serious injuries | 9% |
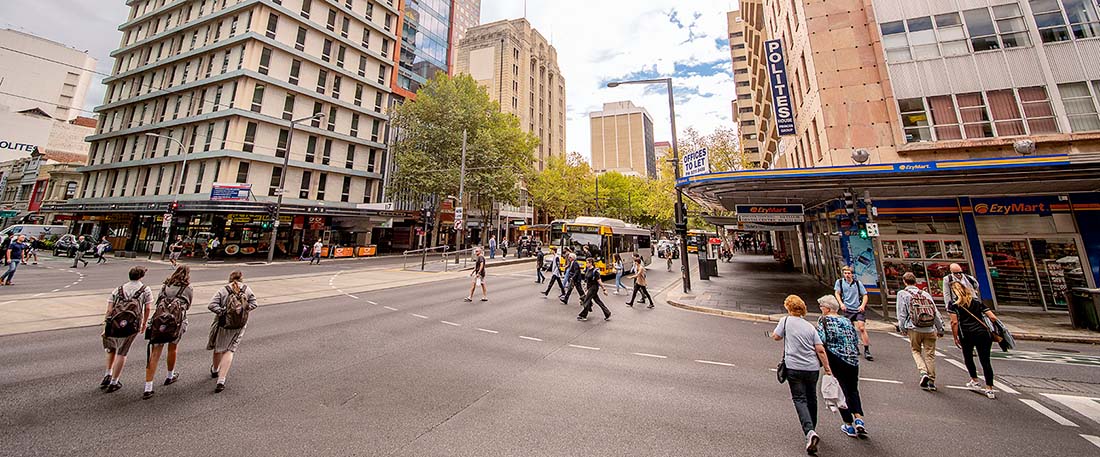
Almost everyone is a pedestrian at some time. Pedestrians can be defined as someone who walks, uses a motorised or non-motorised wheelchair or mobility scooter (gopher). Risks to safety are increased because pedestrians are not protected by the structure of a vehicle and in the event of a crash, are more susceptible to the possibility of loss of life or serious injury. Pedestrians are at greater risk of death and injury if hit at impact speeds above 30 km/h. The most vulnerable pedestrians are children and older people.
Pedestrians are most exposed in busy areas. 82% of pedestrians who lose their lives or are seriously injured are located within the metropolitan Adelaide area at the time of the crash. Nearly one quarter of pedestrians who lose their lives or who are seriously injured are aged 70 years or older.
The presence of alcohol or drugs in a pedestrian’s system can impair their ability to safely negotiate roads and traffic. From 2015-2019, 28% of pedestrians tested following a fatality were found to have a blood alcohol concentration of more than 0.05. On average, 16% of pedestrians killed tested positive to cannabis, MDMA (ecstasy), methamphetamine or a combination of these drugs.

Cyclists
| Lives lost | 5% |
|---|---|
| Serious injuries | 9% |
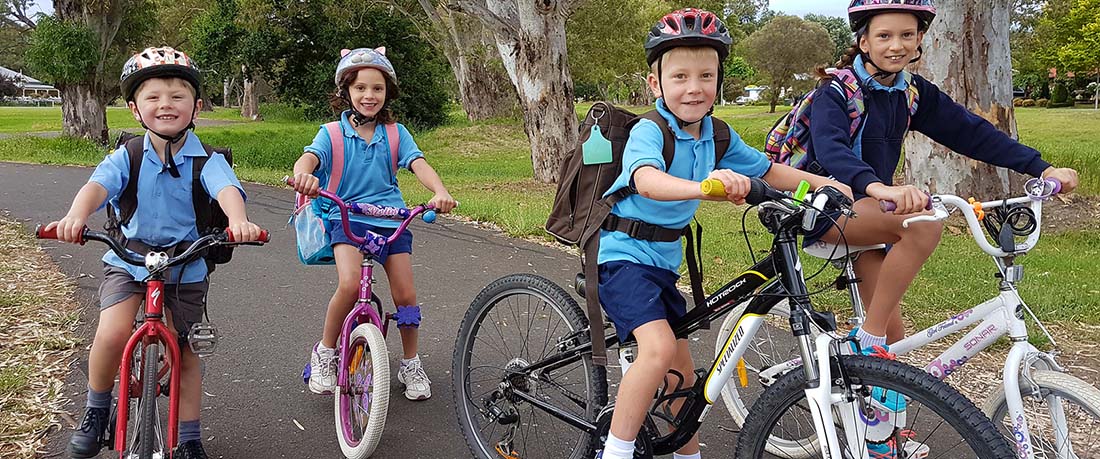
The cycling participation rate7 in South Australia is similar to the national average. Approximately 13% of the population ride weekly and just under one third have ridden in the past year. The cycling participation rate is higher for males and those aged under 18 years. Since 2007 the weekly bicycle traffic in the Adelaide CBD has increased by 56%.
Most (90%) serious injuries involving a cyclist occur in metropolitan Adelaide while just over half (52%) of lives lost are outside the metropolitan area. Half of the lives lost in regional and remote areas involve a cyclist being hit from behind. 70% of cyclist lives lost are in crashes that involved another vehicle.
Most crashes resulting in lives lost or serious injury of a cyclist occur at peak times of the day, around half occur between 6 am and midday and another 25% occur between 3 pm and 6 pm. 42% of lives lost and serious injuries occur at intersections, almost half of these are right angle type crashes and of these, the driver (not cyclist) was identified as at fault in almost two thirds of crashes.

Motorcyclists
| Lives lost | 17% |
|---|---|
| Serious injuries | 21% |
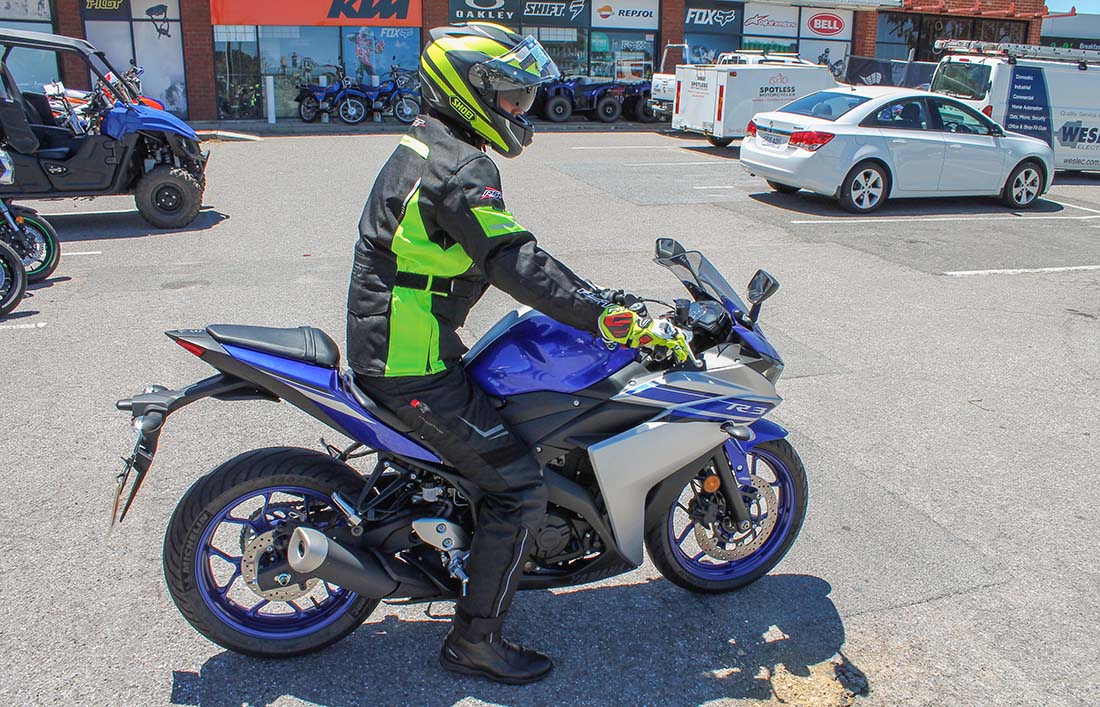
Motorcycle riding is becoming more popular with an increase in the total number of registered motorcycles in South Australia over the past five years, mostly over 250cc engine capacity.8
Motorcyclists continue to account for a considerable proportion of South Australia’s road trauma and have a higher risk of death or serious injury than all other road users. For the numbers of kilometres travelled, motorcyclists have a much higher risk of losing their life than those travelling in other motor vehicles. Motorcyclists do not have the benefit of vehicle protection in the event of a crash and tend to sustain multiple injuries to the head, chest and legs, either from direct contact with solid objects or as a result of crash forces.
Motorcyclists represent 17% of all lives lost yet only 4% of all registered vehicles on South Australian roads. Of the motorcyclist crashes that result in lives lost or serious injury, 65% occur in the metropolitan Adelaide and CBD area.
Over half of motorcycle crashes (55%) which resulted in a life lost or a serious injury involved the motorcycle only. Most of these crashes (87%) were run-off-road crashes and just under one half occurred on a curved section of the road.
In addition, 44% of the motorcycle crashes which resulted in a life lost or a serious injury involved more than one vehicle. Right of way violations by the other road user was a factor in 37% of the crashes where a life was lost and 57% of serious injury crashes.

Males made up 94% of motorcycle rider lives lost and serious injuries compared to 60% of light vehicle driver lives lost and serious injuries in South Australia. 87% of motorcycle licence holders in South Australia are male.
Behavioural factors including speed, alcohol, drugs, fatigue and riding unlicensed remain significant contributing factors to motorcycle crashes that result in lives lost or serious injury. Inappropriate speed is a contributing factor in 54% of crashes where a life is lost and 31% of serious injury crashes involving a motorcyclist.
Thirty per cent of riders who lost their lives on South Australian roads were not licensed for riding at the time of the crash. This may be due to the rider never holding a motorcycle licence or the current licence being suspended or cancelled.
The condition of the road surface is important for motorcyclists whereby pot-holes, crumbling pavement, loose gravel and other debris on the road surface can present significant problems for riders.

