
Road Safety Data
Our road safety data provides a snapshot of lives impacted and support to improve road safety.
2024 road crash data snapshot
The data below comprises lives lost and serious injuries in 2024 compared to the previous five-year average (2019–2023). They are broken down into categories by:
- age group
- location
- road users.
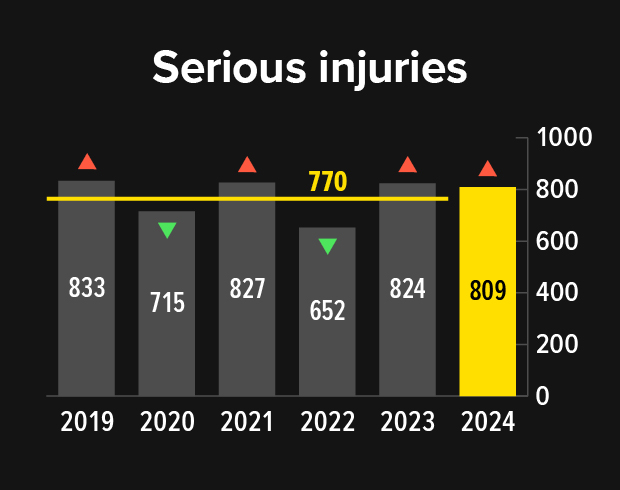
Total lives lost and serious injuries

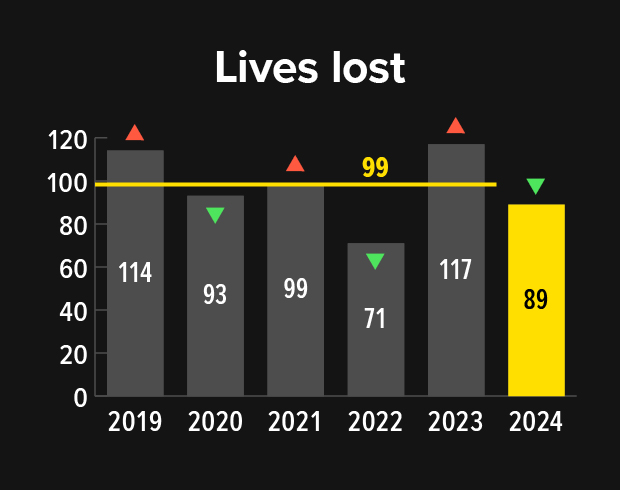
During 2024, 89 lives were lost on South Australian roads. This was:
- 24% less than the 117 recorded in 2023
- 10% less than the previous five-year average (2019–2023) of 99 lives lost.
Additionally, 809 people were seriously injured in road crashes across the state in 2024. This was:
- 2% less than the 824 number recorded in 2023
- 5% more than the previous five-year average of 770 serious injuries.
Lives lost and serious injuries by age group
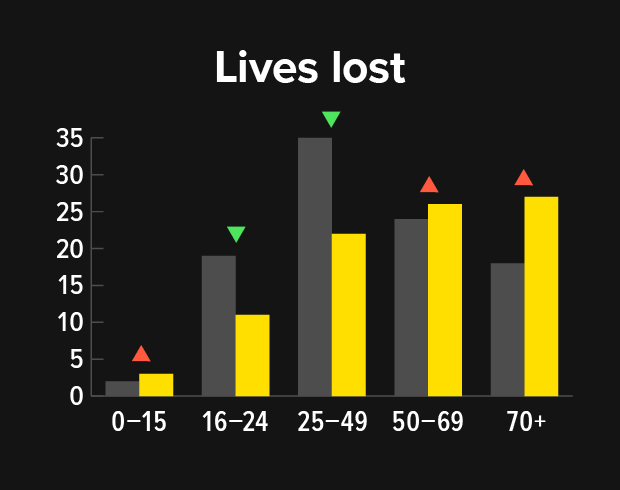
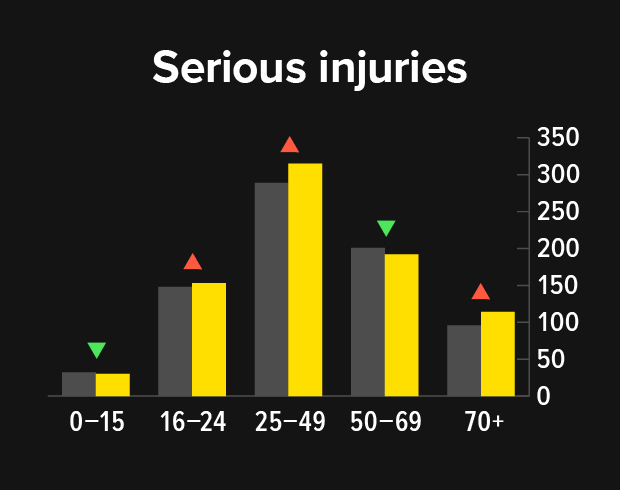
The number of lives lost has declined compared to the previous five-year average. However, this data is not consistent across all age groups. The number of lives lost in the 50+ age group increased, while the younger age groups saw a decline.
The number of serious injuries was higher in 2024 across most age groups, except for:
- 50–69 years
- 0–15 years.
Lives lost and serious injuries by location

When we take the population into account, more drivers and riders die or are seriously injured in regional and remote South Australia. Metropolitan Adelaide has lower rates.
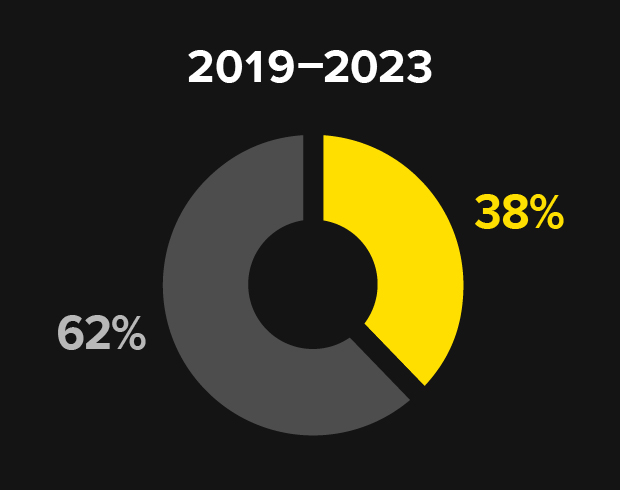
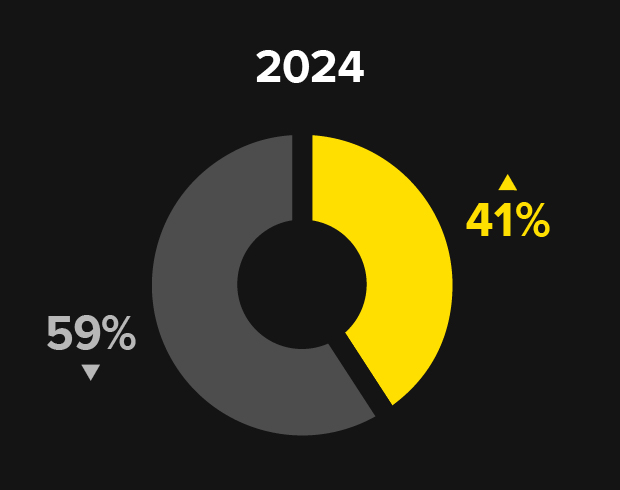
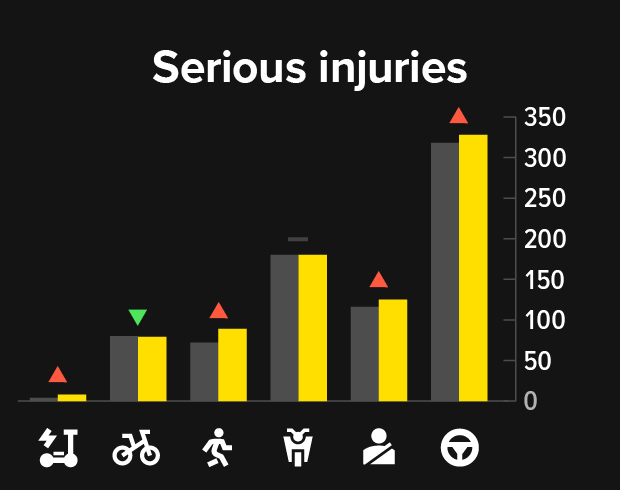
Lives lost and serious injuries by road users
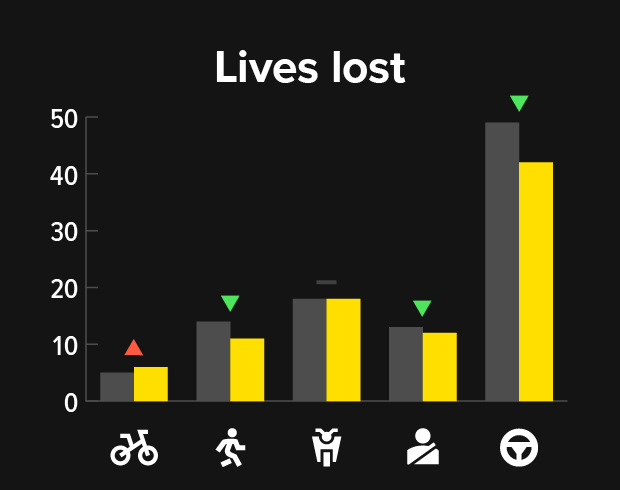
All road user groups recorded a decline in the number of lives lost compared to the previous five–year average. Only cyclists recorded a slight increase.
The number of serious injuries increased against the five–year average for:
- personal mobility devices
- pedestrians
- passengers
- drivers.
However, there was a small decline in the number of cyclists seriously injured.
Motorcyclist numbers remained steady for lives lost and serious injuries in 2024 against the five–year average (2019–2023).
Monitoring and evaluation framework
The South Australian Road Safety Strategy to 2031 aims to improve road safety for everyone. The nation's vision is to achieve zero lives lost by 2050.
The strategy is supported by a robust monitoring and evaluation framework, which:
- identifies how road safety actions are leading to change
- allows us to assess and review actions
- allows us to adapt and adjust our approach.
The monitoring and evaluation framework adopts 26 safety performance indicators (SPIs). They allow us to track the progress of road safety outcomes throughout the life of the strategy. They were selected in consultation with road safety researchers and stakeholders to improve how we collect data in South Australia.
For details about this framework, visit Measuring success.
Road safety data for South Australia represents:
- latest data
- archived reports.
The 2024 annual results are published in the Road Safety Action Plan Annual Report 2024.
Latest data
Find the latest road crash data on lives lost in South Australia.
Daily update of lives lost
Reports
Fact sheets for road crashes 2019–2023
Information in these fact sheets is mainly sourced from the Department for Infrastructure and Transport's Road Crash Database.
Get an in-depth look at key issues and statistics on topics that address fatal and serious injury crashes:
Data.SA
Data.SA is the South Australian Government's open data portal, where you can find:
National road safety data
The Government of South Australia provides regular road safety data to the Bureau of Infrastructure and Transport Research Economics (BITRE). The data is added to the:
- Australian Road Deaths Database
- National Road Safety Research and Reporting Database.
BITRE publishes monthly, quarterly and annual road safety statistics. The data is collated from state and territory data to produce a national picture.
The National Road Safety Data Hub provides nationally consistent and timely data and information. The aim is to support the prevention of fatal and serious injuries on Australian roads. As a part of this, Australian and state and territory governments worked together to establish the national road safety catalogue.
Archived reports
Find past reports on lives lost and serious injuries in South Australia.
Reports on lives lost and serious injuries
Annual progress reports
- South Australia's Road Safety Interim Annual Progress Report 2022 (PDF, 569.4 KB)
- 2020 Progress Report (PDF, 889.7 KB)
- 2019 Progress Report (PDF, 1.5 MB)
- 2018 Progress Report (PDF, 1.3 MB)
- 2017 Progress Report (PDF, 1.3 MB)
- 2016 Progress Report (PDF, 1.1 MB)
- 2015 Progress Report (PDF, 2.4 MB)
- 2014 Progress Report (PDF, 1.3 MB)
- 2013 Progress Report (PDF, 951.2 KB)
Statistical summaries
- 2022 Road Crashes and Casualties (PDF, 2.8 MB)
- 2021 Road Crashes and Casualties (PDF, 2.8 MB)
- 2020 Road Crashes and Casualties (PDF, 2.6 MB)
- 2019 Road Crashes and Casualties (PDF, 3.0 MB)
- 2018 Road Crashes and Casualties (PDF, 2.9 MB)
- 2017 Road Crashes and Casualties (PDF, 3.8 MB)
- 2016 Road Crashes and Casualties (PDF, 4.3 MB)
- 2015 Road Crashes and Casualties (PDF, 3.5 MB)
- 2014 Road Crashes and Casualties (PDF, 2.7 MB)
- 2013 Road Crashes and Casualties (PDF, 2.9 MB)
- 2012 Road Crashes and Casualties (PDF, 1.6 MB)
- 2011 Road Crashes and Casualties (PDF, 1.2 MB)
- 2010 Road Crashes (PDF, 1.0 MB)
- 2009 Road Crashes (PDF, 1.0 MB)
- 2008 Road Crashes (PDF, 1.0 MB)
- 2007 Road Crashes (PDF, 1.3 MB)
- 2006 Road Crashes (PDF, 925.2 KB)
- 2005 Road Crashes (PDF, 664.0 KB)